Pardon me for several basic questions.
Can someone circle the part of the image that they mean by spiked T waves?
Can someone circle the QRS and explain the possible reasons for its appearance?
Thanks
I don't know your level or ability to interpret, if you are experienced and trying to understand how people came to their conclusions, but if you are a student or new, this is not a great ECG example to learn from. It looks like there are some artifacts (outside interference causing the ECG to be distorted), a lot of it is small and questionable.
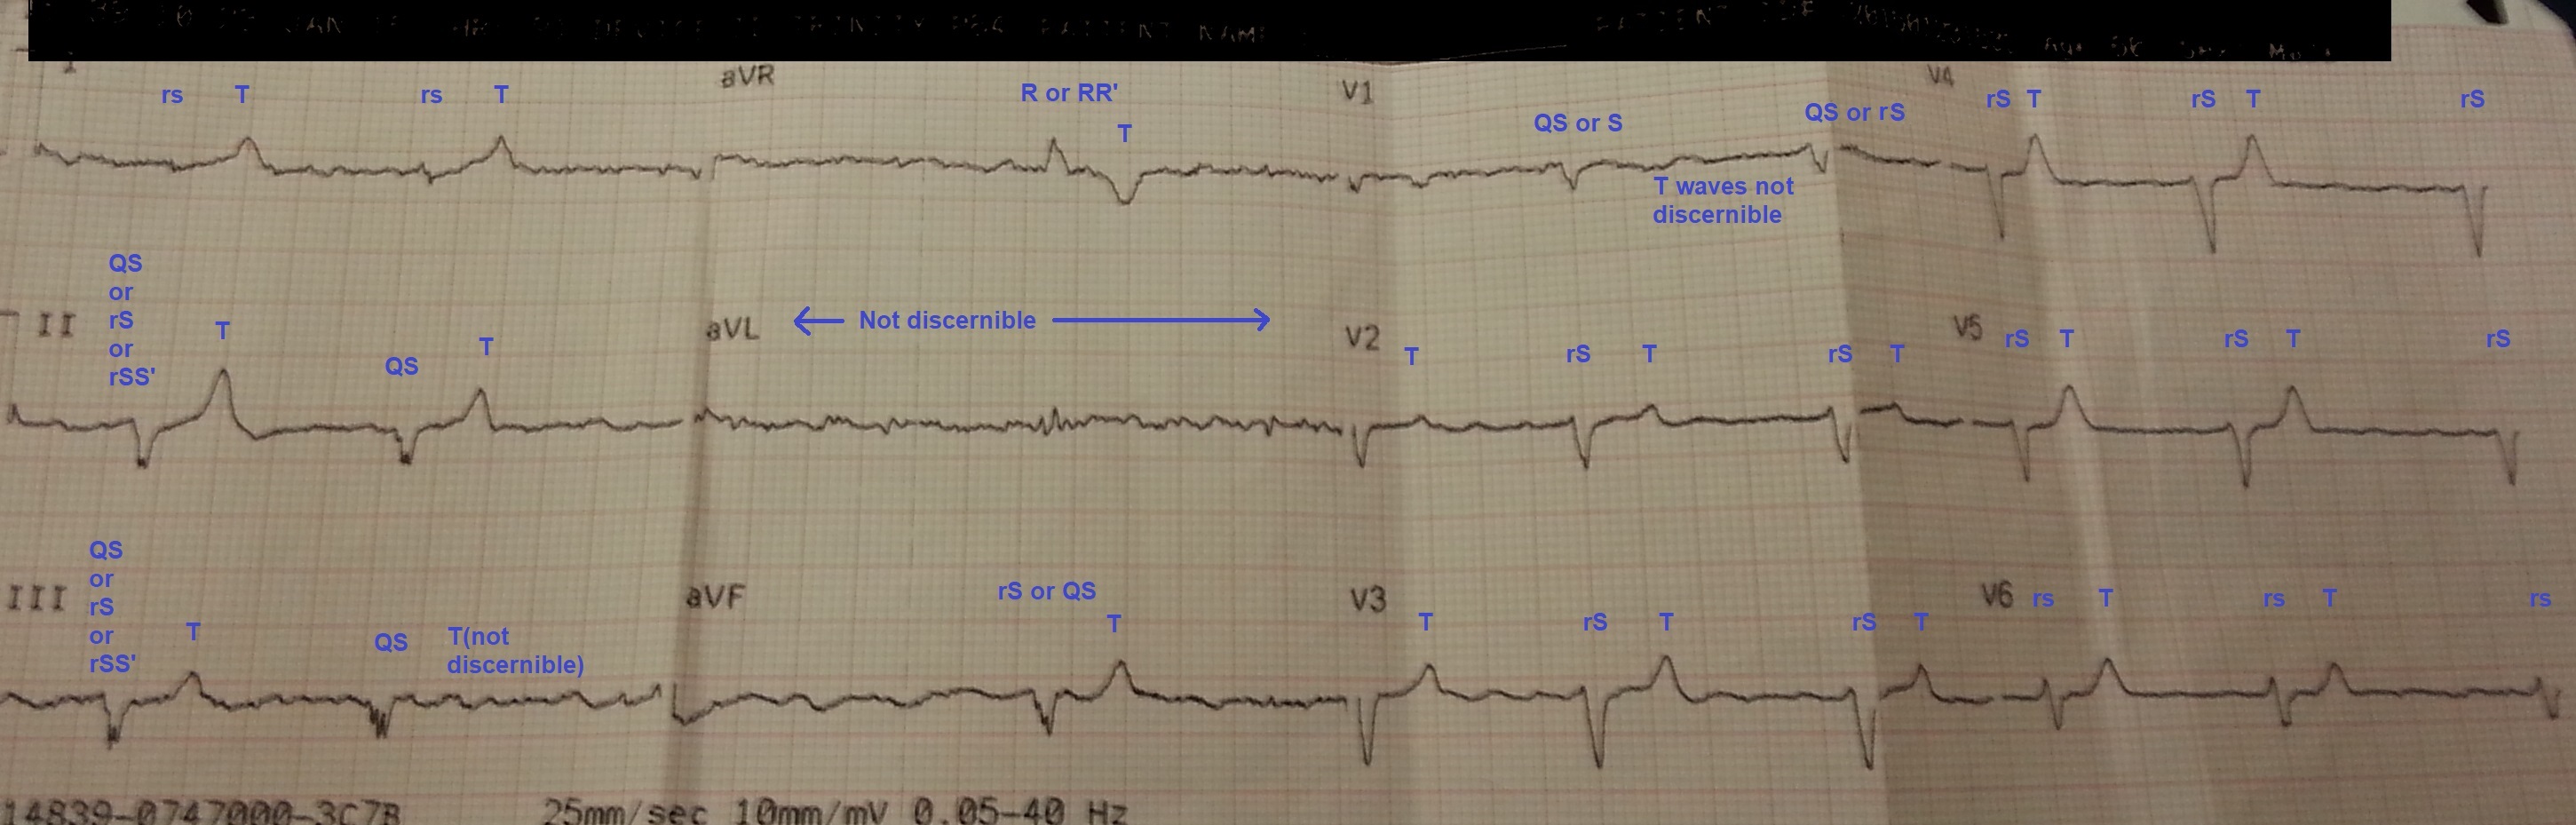
This is how I broke it down or saw it. Like I said, some of it is questionable.
For any QRS complex, the size of the letter is based on the size of the QRS complex. For example, a big R wave is written as R and a little r wave is written as r. rS means it has a small r wave followed by a big S wave. qrS means it has a small q wave, small r wave, and a big S wave. I think the only weird thing is that usually an S wave is not written by itself, if there is no R or r wave with the S wave, it is written as QS or qs. You'd include any small deflection so sometimes you might see an initial small r wave at the beginning with a big S wave following it. Like in lead II here, it is questionable if that is due to artifact or if there is an initial r wave at the beginning. That could be a QS wave or it could be an rS wave. It's questionable. Lead V2 is an excellent example of an rS wave where there is definitely an r wave in the beginning even though it is small. Anytime there are extra waves, you put an apostrophe after it and it is called "prime". A common example is right bundle branch blocks (RBBB) will have rsR' wave.
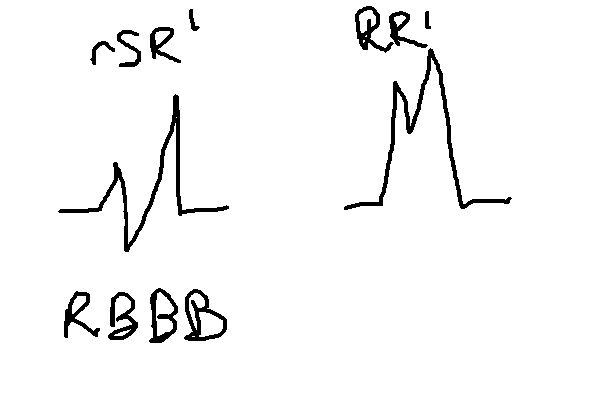
(RBBB is meant to stand for right bundle branch block, there are no B waves.. not a thing)
You can also write something like RR' or something like that, if the deflection is small before the second prime wave. This is somewhat subjective and up to the interpreter. I think for the most part, it's kind of moot and not that important, in my opinion. I am okay with people just saying or writing "QRS complex" instead of breaking it down by wave. You could call all these "QRS" and I'd be totally happy with that. Trying to figure out size or what is what is kind of subjective, kind of. Like the inferior leads II, III, aVF, and then lead V1, are examples of that subjectiveness, are those showing initial r waves or not? To me, it kinda looks like it, but it could be argued that these are QS waves. Who knows?
Any part of the QRS is going to be based on what has more negative and positively charged cells I guess you'd say? I like to imagine it like a football field or soccer field where there is a line in the middle and you are comparing the two. Hopefully I don't get these charges mixed up (I reverse them sometimes, haha), but it goes something like this.
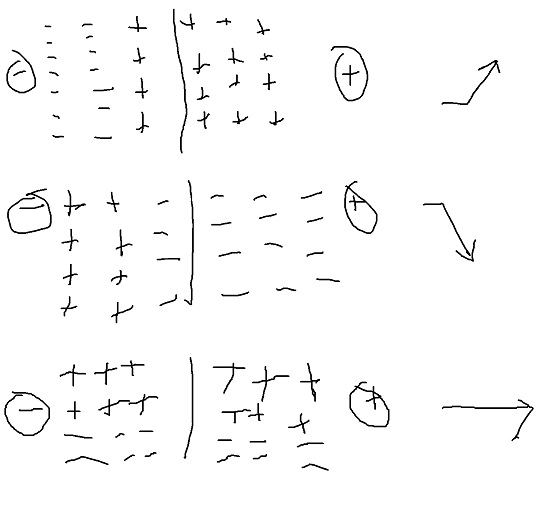
How it is normally taught in books is not by thinking of individual cells, but rather as a mean or average of all of them combined and what is becoming more positive. If the positive is headed towards the negative lead, it creates a downward deflection. If it heads more towards the positive lead, it creates a upward deflection. If it is perpendicular to the positive and negative lead, because both sides have an equal or near equal amount of positive and negatively charged cells, it is isoelectric or flat. Because books tend to tend to primarily teach using the mean QRS vector, it can be someone tricky to comprehend how you can have so many deflection or waves. This mean is looking at everything at once, but in reality, there might be depolarization in different parts of the heart and slightly different timing. There is a little bit overlap.
So for example, the inferior leads II, III, and aVF (aVFoot), the positive electrode (labeled LL for left leg, put sideways... looks like an F for Foot, good way to learn this). All this means is that the mean QRS vector is going away from the foot/LL leg lead. That's all. I would say for the most part, at leas for me, it doesn't really mean much. It's more of a fun fact and maybe help me determine a block name (eg left anterior fascicular blocks are going to have "extreme" left axis deviation* and the inferior leads are going to be negative or the mean QRS vector is going to be going away from the foot). Note: it's not normal for people to say extreme left axis deviation, but when I look for left anterior fascicular block (LAFB) (or Dale Dubin's book and how some people learned it, they say left anterior hemiblock (LAH)), you are usually looking for a lot of left axis deviation, greater than 30 or 45 degrees (Thomas Garcia book on 12-lead) says >45 degrees looking for an S wave in lead II that is deeper than the r wave , but I am not sure if that is a hard rule or not (I personally look for poor R wave progression along with left axis deviation when I commit to saying LAFB).
These electrical rules apply to other waves in 12-leads as well, including P wave and T waves. You can actually calculate the mean vector of these waves and a lot of 12-lead machines automatically do this for us. So when a T wave is small or near isoelectric, it's likely because the mean T wave vector is perpendicular to the lead. So in lead aVL in this 12-lead, we don't see the T wave really and that means the mean T wave vector is perpendicular to it. The T wave is positive in all the other frontal leads except lead aVR so the T wave mean vector is about +60 degrees I believe.
Anyways, what we see here is the high lateral leads I and aVL are near isoelectric. That means on our imaginary football or soccer field where you are drawing a line in the middle, the positive and negative sides have about the same amount of positive and negatively charged cells, which means the mean QRS vector is perpendicular to them. The inferior leads II, III, and aVFoot here are all mostly negative downward deflection. That means the mean QRS vector is pointing up, away from the foot, and it is either pointing straight up away from the foot towards the patient head around -90 degrees OR it is pointing slightly upward and to the right about -120 degrees. For me personally, it is kind of hard to tell further or to what degree because the QRS complexes are so small here and a lot of them are close in size that it is hard to tell a different.
Um, something to point out is the size of the T waves in here. These T waves by themselves are not very big. Again, this I wouldn't consider very classic personally. The reason these are big is when you compare them to the size of the QRS complexes they are associated with. A lot of these QRS complexes are very small, yet have T waves that are as big or bigger than them. Considering that normally the T waves are half or less the size of the QRS wit them, these are big. Electrolyte imbalances can change wave size, obesity/fat can make the waves smaller, pregnancy, pericardial tamponade and myxedema coma come to mind. In general, I don't feel like there is any real significance to trying to figure out what is causing small complexes usually because I am usually comparing them size of each wave to each other.
Amal Mattu calls hyperkalemia the syphilis of ECGs. It will create a lot of weird patterns. "Classic" patterns for hyperkalemia are tall, peaked, narrow, symmetrical T waves early on when the hyperkalemia isn't as severe. I feel like this is usually most appreciated in the precodial leads (even in normal 12-lead, the T waves in those leads are usually the biggest), which is something we see here. This is usually an early finding. As the hyperkalemia worsens (more and more potassium outside of the cell, normal lab value is between 3.5-5.3 mEq/L or mmol/L, whatever unit you like to use, sometimes people use slightly different lab range like 3.5-5.0, not a big deal), typically the P-waves will become smaller (cannot appreciate any P waves in these 12-leads), the QRS complexes will become more wide and merge with the T wave creating a sine wave or z-fold appearance. You sometimes cannot even tell what is the T wave or QRS. A lot of people are used to looking at either extremes, tall peaked T waves, symmetrical, T waves you wouldn't want to sit on unless you are into BDSM or sine waves or Z folds. Most 12-leads I see with hyperkalemia are going to be somewhere in between... they are not going to have classical findings that are taught. They are going to have intraventricular conduction delay (IVCD) where they might not follow typical bundle branch block patterns. Thomas Garcia teaches that in his book, Art of Interptation:12-lead, that the #1 cause of IVCD is hyperkalemia so consider that when you don't see a typical pattern.
In a lot of cases, I would say axis, rhythm, STEMI, it's pointless to really try to diagnose these I feel like with hyperkalemia. Correct the hyperkalemia first, redo the 12-lead, and move on. Treat hyperkalemia almost like an artifact where it is not really important to interpret the 12-lead beyond hyperkalemia. Correct that "artifact" and then make an interpretation.