Another Cold Read

Aprz

The New Beach Medic
3,031
664
113
I got this 12-lead from the ECG Club on Facebook, and got the original poster's permission to post it here since I thought this was a fun 12-lead to interpret.

No further information on the patient's age, chief complaint (if any), medications, and pre-existing conditions.


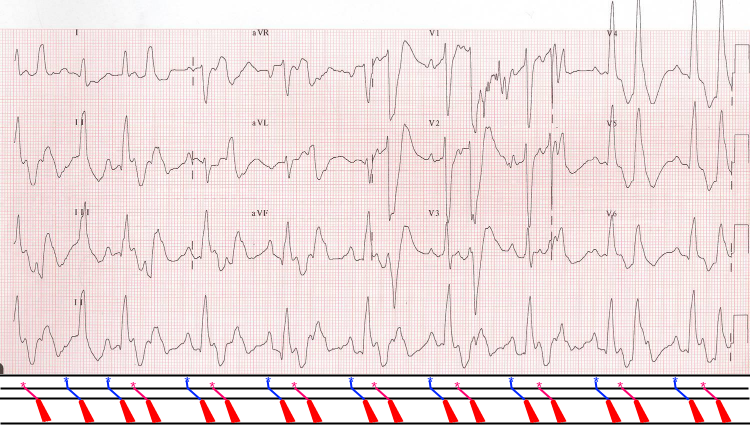
(Click on the image to view a larger resolution.)

One of my favorite things about this particular case is that we have no information, we don't even know for sure what the rhythm is. Tell us what you think. You might be right. You might wrong. Who knows?
 
Last edited by a moderator:

VFlutter

Flight Nurse
3,728
1,264
113
I see clear distinct P waves so I am thinking it is a Sinus Rhythm or Atrial Tach with some type of pre-excitation and Ventricular Ectopy (Maybe from the RVOT)

There is a fairly regular P-P
 
Last edited by a moderator:

PotatoMedic

Has no idea what I'm doing.
2,704
1,543
113
I'm still learning EKG s could anyone in a few posts label the waves? I think I see the P's the qrs and a t (inverted?) But it would be nice to get some conformation. Thanks. Maybe I'll label it in an hour or so and people can correct me.
 

Jambi

Forum Deputy Chief
1,099
1
36
Lots of issues in that tracing

Off the top of my head.

Sinus with the PACs and a LBBB. I think I also see Wellen's sign too.

I also doing this because it may make me look like an idiot...but it could also be a 3rd degree with junctional tach and a LBBB.

I feel like a moron sometimes. ECGs are easy to learn, but hard to master.
 
OP
OP
A

Aprz

The New Beach Medic
3,031
664
113
...

...

...

I also doing this because it may make me look like an idiot... ....

I feel like a moron sometimes. ECGs are easy to learn, but hard to master.
Don't worry about it. :) In the EKG Club, a lot of people had different answers, and even a doctor that is a regular poster in there changed his mind from one thing to a total another thing. We all had interesting answers; no easy explanation.
 

PotatoMedic

Has no idea what I'm doing.
2,704
1,543
113
Ok here is what I saw. (Note I am only playing with lead 2 since well... that is all I really "know" at the moment.)

Red marks are P waves. Brown is the QRS. and Blue are the t waves. The one purple wave is a PVC. So possibly sinus rythem with wide qrs and a pvc?

Now what I am also thinking is that the blue marks are p' (P prime aka non sa node generated p waves) waves so we have atrial tach with wide qrs and inverted t waves?

Honestly I am not really sure. For all I know I could be way off!
 

Attachments

  • ecglarge.jpg
    ecglarge.jpg
    97.9 KB · Views: 273
Last edited by a moderator:

Christopher

Forum Deputy Chief
1,344
74
48
I got this 12-lead from the ECG Club on Facebook, and got the original poster's permission to post it here since I thought this was a fun 12-lead to interpret.

I saw that ECG and said, "I'll wait until I have more time." Frankly it is beyond bizarre looking.

I'll start with what I think it is: sinus-ish rhythm with multiform bigeminal PVC's r/o atrial bigeminy w/ varying degrees of aberrancy; also an underlying IVCD and 1AVB. This likely indicates conduction deficits below the AVN causing the prolonged PRi.

Now we can break it down:

1. We have obvious P-waves in V1-V3, which we can line up with some of the fairly peaked findings. I see that this is recorded at Standard so we're not dealing with a gain finding. The patient apparently has a crazy huge right atrium.

2. In V1 all sinus complexes are conducted with an rS, and I/V6 are Rs and qR respectively, which makes this an IVCD rather than LBBB.

3. We have grouped beats: indicating Wenckebach, Mobitz II, or Ectopics at play.

4. We've got some divots before some of our ectopics which look suspiciously like P-waves...except they have a shorter PRi so they may not be P-waves. They could also be retrograde and be reciprocal echo beats. It could also be atrial tachycardia. Many options. I do not believe it can be AT as the P-P's would not march out.

V3 is the best lead and I wish there was a rhythm strip from just that lead!

I think the most likely is Atrial bigeminy, second being reciprocal echos. The last two ectopics may be purely ventricular. I believe the actual intrinsic rate is illustrated by the 3rd and 4th R-waves, best seen in I.

 
Last edited by a moderator:
OP
OP
A

Aprz

The New Beach Medic
3,031
664
113
This is what I posted in the EKG Club.

Aprz said:
I'll try.

To me, it looks likes a bunch of couplets.

Look at lead I. There is a half shown complex (I'll refer to this as #1), then a different complex after it (#2). Ignore the third complex for now, start again the fourth again, and match those below with lead II at the bottom. So #1 & 2, #4 & 5, #5 & 6, etc. are all couplets in my opinion. Oddly, it doesn't look like couplets in lead II until complex #16 near the end.

There is a visible P-wave in V1, and when I look down at lead II at the bottom, it's the big blob before what looks like a somewhat normal complex in lead II. All of the normal somewhat looking complexes have it, and the start of it is about 7 little boxes before the start of the complexes, or greater than 1 big box, or 0.28s.

P-waves (for what I am positive are p-waves) is positive in I, II, III, and aVF. I don't really believe it's sinus though.

The QRS complexes are positive in lead I and aVF too, it's at least within the normal axis supporting that electrical activity is coming from the atria.

I think it's ventricular bigeminy with 1st degree AVB. Some sort of intraventricular conduction delay (doesn't look like RBBB or LBBB to me, everything looks like an IVCD to me now-a-days, haha!). I'm not really thinking hyperkalemia either though.
Also I noticed I made a mistake saying what's coupled with what (just didn't think about the numbering) and meant to say 1 & 2, ignore 3, 4 & 5, 6 & 7, etc. are couplets. And then I didn't feel like it was easy to describe so I tried showing it with pictures like some of you did here too, and further described it.

Aprz said:
To show what I see.

couplets1small.jpg

(Click on the image for a higher resolution.)


That should show how I see what I think is each complex based on looking up and down on each lead. This is what makes me think it's couplets.

couplets2small.jpg

(Click on the image for a higher resolution.)

This should show how I determined what is a P-wave in lead II.

couplets3small.jpg

(Click on the image for a higher resolution.)

What I looked at that makes me think it's neither RBBB or LBBB. V1 doesn't have qR or rsR', and it's mostly negative. I and V6 look somewhat similar, doesn't really have S-wave you see in RBBB. Just doesn't look like LBBB either to me, LBBB usually looks one way through out ECG, but that's not the case here. It's closer to LBBB looking than RBBB, but I think it's neither.
Remember that we could not determine the right or wrong answer. What I am posting is what I believe is going on.

Christopher, wouldn't the ectopic beats more likely be ventricular? I actually made this decision based on V3 because the sinus beat has a positive complex and the ectopic beat has a negative complex.
 
Last edited by a moderator:

Christopher

Forum Deputy Chief
1,344
74
48
This is what I posted in the EKG Club.


Also I noticed I made a mistake saying what's coupled with what (just didn't think about the numbering) and meant to say 1 & 2, ignore 3, 4 & 5, 6 & 7, etc. are couplets. And then I didn't feel like it was easy to describe so I tried showing it with pictures like some of you did here too, and further described it.


Remember that we could not determine the right or wrong answer. What I am posting is what I believe is going on.

Christopher, wouldn't the ectopic beats more likely be ventricular? I actually made this decision based on V3 because the sinus beat has a positive complex and the ectopic beat has a negative complex.

I see it as so short coupled more of the ventricles is partially refractory so it takes longer to conduct.

Otherwise I find it hard to explain the P-waves since they're positive in the inferior leads and lead I.
 
Top