Interesting EKG

captaindepth

Forum Lieutenant
151
60
28
12 lead 2:17:16.jpg


Snapped this really interesting EKG the other day. The pt was an extremely poor historian from an independent living facility and staff was not much help either.

All vital signs WNL, pt denies any C/P, SOB, or dizziness and only states he has had increased weakness over the past 48 hours with intermittent N/V. Only medical hx was diabetes which is controlled via oral medications, no drug or alcohol use reported reported or suspected. The pt adamantly wants to refuse transport.

What do you think?
 

STXmedic

Forum Burnout
Premium Member
5,018
1,356
113
Looks like very pronounced Wellens waves. The high amplitude may be making them stand out more than what's typical.@Aprz Youre pretty good at this stuff...

Edit: Guess I should throw in the 1* block, LVH criteria, and RBBB...
 
Last edited:

MonkeyArrow

Forum Asst. Chief
828
261
63
Looks like very pronounced Wellens waves. The high amplitude may be making them stand out more than what's typical.@Aprz Youre pretty good at this stuff...

Edit: Guess I should throw in the 1* block, LVH criteria, and RBBB...
Wellens is not diagnostic in the presence of Bundle Branch Block. Also, not as accurate in black or caribbean males.
 
OP
OP
captaindepth

captaindepth

Forum Lieutenant
151
60
28
This shows a pretty clear cut RBBB morphology. Positive QRS in V1 with deep terminal S waves in lead I and V6, and of course it's wide. LBBB is a negative QRS complex in V1 with positive QRS complexes in lead 1 and V6, and of course wide (> 0.12sec). What is concerning here is the concordant T wave changes in the lateral leads and the excessive ST segment depression in the anterior leads.
 

STXmedic

Forum Burnout
Premium Member
5,018
1,356
113
Wellens is not diagnostic in the presence of Bundle Branch Block. Also, not as accurate in black or caribbean males.
That's what I was unsure of. Thanks
 

Aprz

The New Beach Medic
3,031
664
113
I'm glad you guys thought of me, but I don't really feel like I have a really good answer for this.

I estimated the rate to be around 115 because I counted about 13 mm between complex #1 to #2 and then #2 to #3. The computer estimated a rate of 108, which means it measured an R to R interval that is about 1 mm further . That's not that far off. Computer is probably correct with the rate.

It's a regularly regular rhythm in my eyes. I'm not using calibers though. I honestly don't see anything that strikes me as a "definite" P-wave. I see some inconsistency with things that do look like P-waves eg after the second complex in lead II and lead III, and then after the fourth complex in lead III. It's not consistent. Also, in my experience, the P-wave is usually not very visible or easy to see throughout the entire ECG even on a normal 12-lead. I see what would look like a P-wave merged with the T-wave, but it is very easy to see through the ECG. I would consider this abnormal for a P-wave personally. The complexes are wide. I didn't measure it, but the computer estimated 146 ms (although barely, >140 ms is less likely to be due to RBBB). It has a RBBB-like morphology because it is positive in lead V1. In my opinion, it doesn't have a typical RBBB morphology of rsR' or qR or some variation of that. To me, it looks like a tall R-wave with an increase intrinsicoid deflection that kind of looks like a delta wave to me. In hypertrophy, it is common to see an increase an intrinsicoid deflection.

5dGX5cq.jpg

My poor attempt of outlining what I see.

I see people mistaken call left ventricular hypertrophy as an accessory pathway because they see this pseudo delta waves in the lateral leads. I'm not calling this left ventricular hypertrophy or any hypertrophy. Honestly though, this kind of looks like an avrt/WPW with a left sided accessory pathway (left side would create a RBBB-like morphology). Seems weird that this person wouldn't have on record that they have an accessory pathway or wouldn't know about it since they are at a skilled nursing facility. I don't really see too many avrt/WPW, so I am not even confident in this answer. This is just what I first thought of when I saw it and just kind of have a "feeling" that this is what it is. Not sure how to explain the lack of P-wave or if maybe at the terminal end of the T-wave is really a P-wave, but it just doesn't look like one to me. *shrugs*

When there is RBBB-like morphology, it is very normal for there to be ST depression in lead V1-3. In a normal RBBB that is small, it is hardly noticeable to the naked eye. In something like a VT or anything else with RBBB-like morphology that has bigger complexes, I consider this normal and not due an MI. While it is true that technically some of the T-waves are concordant with the terminal wave of the QRS complex, I personally believe that the direction of the T-wave should be discordant to the mean direction of the QRS in an intraventricular conduction delay rather than to the terminal wave (a purist would say it has to be discordant to the terminal wave, but who cares about what they say? :p
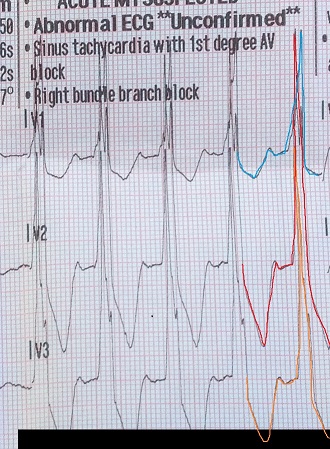
). I usually see this in lead V5 and V6 in some LBBB that have a biphasic T-wave and a tiny terminal S-wave. Computer probably tripping about there being an MI due to the excessive ST changes. I don't feel like the computer usually takes into consideration the amplitude of the QRS complexes so it commonly screams MIs on things like LBBB and LVH.

This does not look like Wellen's pattern to me.
 
Last edited:

STXmedic

Forum Burnout
Premium Member
5,018
1,356
113
Good info aprz, thanks! I need to up my 12lead game I think... Lol
 
OP
OP
captaindepth

captaindepth

Forum Lieutenant
151
60
28
@Aprz Great response! I totally agree about the troubling P wave presence/absence and inconsistency. In lead II it almost like there are multiple P wave morphologies which made me think MAT but the its a regular rhythm which kinda throws a wrench in that theory. I know there is expected discordant ST elevation/depression in the presence of RBBB but I think the depression in V2-V4 is a little excessive especially when compared to the V1 complexes.

I know the story and event hx is rough, which doesn't help, but this one interesting EKG that I still cannot get a beat on.
 

TomB

Forum Captain
393
82
28
Typically with RBBB the T-waves are deflected opposite the terminal deflection of the QRS. In this case the R-waves are fragmented and have a lot of voltage so I would take the T-wave changes with a grain of salt and consider it to be non-specific. Definitely not indicative of acute STEMI. The deep T-wave inversions in leads V1-V4 are normal considering the very tall R-waves.
 

ParamedicStudent

Forum Crew Member
78
3
8
To diagnose any BBB is it 2 or more leads? or can you go by just one? Also to determine which one it is you go by v1 right? and look up or down.

Dont know too much about bundle branch blocks
 

TomB

Forum Captain
393
82
28
I personally use lead V1 to classify RBBB and LBBB but I confirm it in lead I. Technically, if you have RBBB in the limb leads and LBBB in the precordial leads (or vice-versa) it's a nonspecific intraventricular conduction defect.
 

k9Dog

Forum Crew Member
45
9
8
I would turn down the size on the monitor first. Too hard to read otherwise. RBBB with st depression from what I can see, but again it's hard with the massive qrs, gotta turn it down to 1 on the monitor
 
Top